
 Deutsch
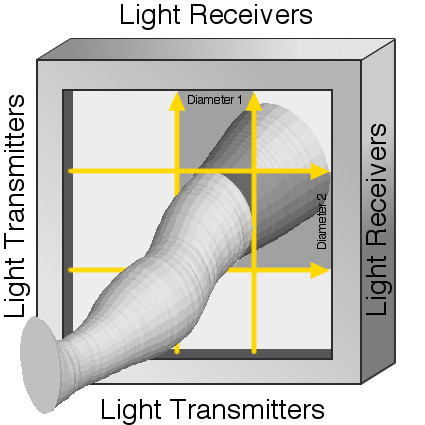
Perometers work with parallel-acting light curtains made of photosensors and light-emitting diodes (LEDs) with which the limb is illuminated and scanned. The actual measuring unit is installed in the frame, which is pushed over the limb.
Two mutually perpendicular light curtains run as shown in the Figure. They take two mutually perpendicular extremity diameters and their position within the frame. If the frame is guided manually over the limb, the diameters and their positions are determined at a short distance along the limb, and two contoured images are automatically taken from two mutually perpendicular sides. The data set is largely independent of the position of the measuring object within the measurement frame. This makes the image recording in practice really easy. Phototechnical details up to the right object lighting are taken into account by the measuring system automatically.
The new 3d analysis technology.
From the recorded measurement data, the new Perometer software PeroScan creates an interactive 3d representation of the extremity. Volume changes are visualized by a colour scale applied to the interactive graphics. The qualitative pre-evaluation of your measurement data thus becomes revolutionarily simple.
As an example, the rotatable graphic on the left shows the leg of a test person during a muscle build-up lasting several weeks: The basis are two measurements taken at intervals of approx. 6 weeks. The red colour indicates an increase in the affected area. It can be seen easily that the thigh volume has increased, but not the calf volume.
Perometers are optimized for easy handling.
Operation with a conventional PC allows simple monitoring and control of the imaging unit. The measurement data are automatically stored, managed and evaluated in a clear manner. For further use Perometer data can be exported into other programs such as word processing programs or other standard software.